3.0 Comparing Models
After Training your Models, What’s Next?
After training multiple models with Anvil, you will want to compare the performance across models in a robust way. Comparing models properly and with appropriate statistical rigour is very important for establishing which models you should be deploying in production for your endpoints.
Just comparing a single number (say a metric like MAE) from a single training run is not a robust way to compare models due to the possiblity of over-optimising to a single split.
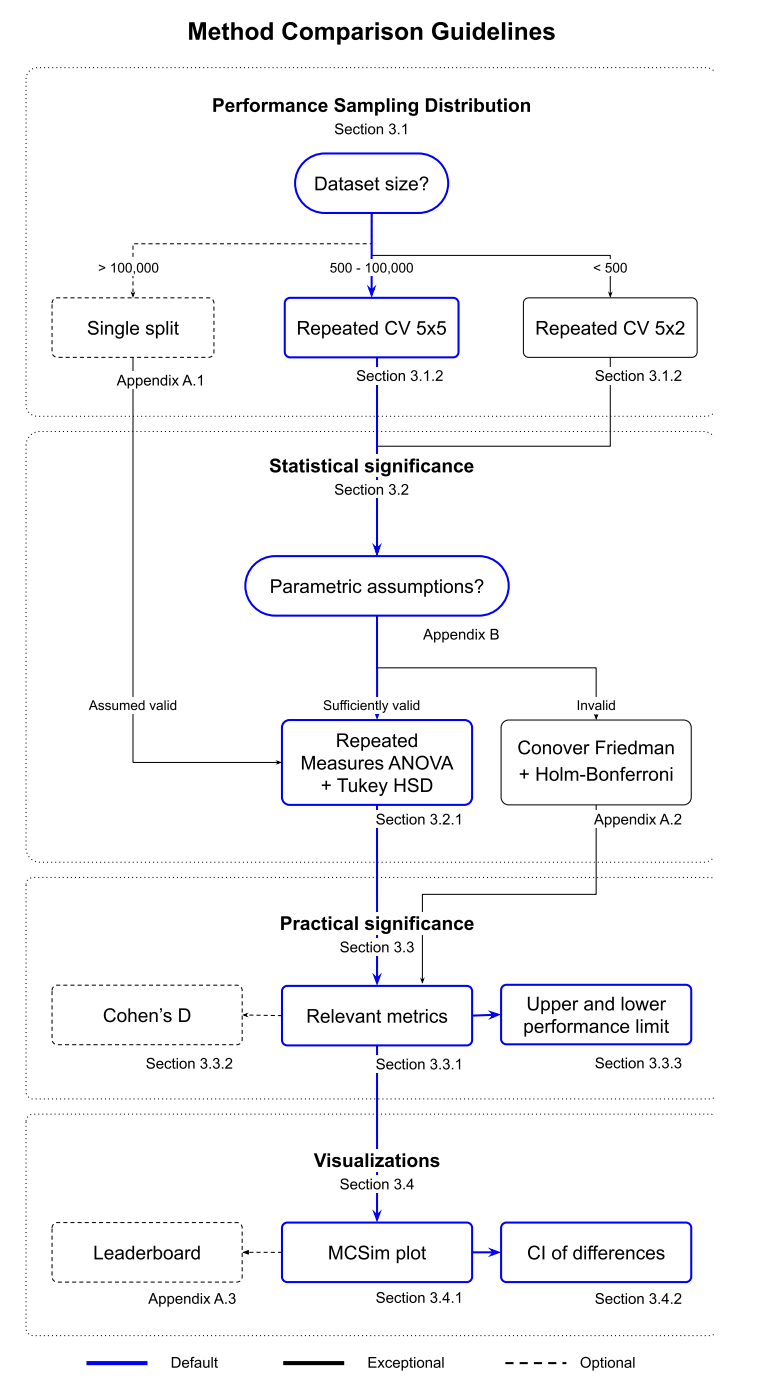
To properly compare models, you should sample from the performance distribution of your model using a technique like cross validation. We closely follow the guidlines laid out in this paper. Consider the below decision chart for helping figure out how to compare your models:
Requirements
For this demo, you will need:
At least 2 models trained with the Anvil workflow.
All models trained with same cross validation splits, e.g. 5 splits x 5 repeats ## Overview This notebook will walk you through how to use the OpenADMET CLI to evaluate models that have been trained with the Anvil workflow. In this particular demo, we will compare the models we trained in
02_Training_Models.ipynb.
Use Anvil to Compare Models
As with training models with Anvil, comparing models is also a simple command with the following arguments:
openadmet compare \
    --model-stats <path-1/cross_validation_metrics.json> \ # this is the path to the cross_validation_metrics.json file output by anvil of your first model
    --model-tag <a-tag-to-label-your-trained-model-1> \ # this can be any moniker that is distinguishable for you
    --task-name <name-of-task-1> \ # this is the name of your target_cols from the anvil recipe.yaml
    \

    --model-stats <path-2/cross_validation_metrics.json> \ # corresponding info for your second model
    --model-tag <a-tag-to-label-your-trained-model-2> \
    --task-name <name-of-task-2> \

    ... repeat this set of arguments for as many models as you want to compare


    --output-dir <path-to-output-plots> \ # this is an existing directory for your plot to export to
    --report <whether-or-not-to-write-pdf-report>
IMPORTANT NOTE You can only compare models that have the same number of cross validation folds, e.g. a model with 5 splits x 2 repeats can only be compared to another model that is also cross validated with 5 splits x 2 repeats.
For this demo, this command is:
[5]:
%%bash
export OADMET_NO_RICH_LOGGING=1

openadmet compare \
    --model-stats-fns ../02_Model_Training/lgbm/cross_validation_metrics.json \
    --labels lgbm \
    --task-names OPENADMET_LOGAC50 \
    --model-stats-fns ../02_Model_Training/chemprop/cross_validation_metrics.json \
    --labels chemprop \
    --task-names OPENADMET_LOGAC50 \
    --model-stats-fns ../02_Model_Training/multitask/cross_validation_metrics.json \
    --labels multitask \
    --task-names OPENADMET_LOGAC50_cyp3a4 \
    --output-dir model_comparisons/ \
    --report True
Intel MKL WARNING: Support of Intel(R) Streaming SIMD Extensions 4.2 (Intel(R) SSE4.2) enabled only processors has been deprecated. Intel oneAPI Math Kernel Library 2025.0 will require Intel(R) Advanced Vector Extensions (Intel(R) AVX) instructions.
Intel MKL WARNING: Support of Intel(R) Streaming SIMD Extensions 4.2 (Intel(R) SSE4.2) enabled only processors has been deprecated. Intel oneAPI Math Kernel Library 2025.0 will require Intel(R) Advanced Vector Extensions (Intel(R) AVX) instructions.
/Users/hugomacdermott/miniconda3/envs/openadmet-demos/lib/python3.12/site-packages/hyperopt/atpe.py:19: UserWarning: pkg_resources is deprecated as an API. See https://setuptools.pypa.io/en/latest/pkg_resources.html. The pkg_resources package is slated for removal as early as 2025-11-30. Refrain from using this package or pin to Setuptools<81.
  import pkg_resources
/Users/hugomacdermott/miniconda3/envs/openadmet-demos/lib/python3.12/site-packages/pydantic/_internal/_generate_schema.py:2249: UnsupportedFieldAttributeWarning: The 'repr' attribute with value False was provided to the `Field()` function, which has no effect in the context it was used. 'repr' is field-specific metadata, and can only be attached to a model field using `Annotated` metadata or by assignment. This may have happened because an `Annotated` type alias using the `type` statement was used, or if the `Field()` function was attached to a single member of a union type.
  warnings.warn(
/Users/hugomacdermott/miniconda3/envs/openadmet-demos/lib/python3.12/site-packages/pydantic/_internal/_generate_schema.py:2249: UnsupportedFieldAttributeWarning: The 'frozen' attribute with value True was provided to the `Field()` function, which has no effect in the context it was used. 'frozen' is field-specific metadata, and can only be attached to a model field using `Annotated` metadata or by assignment. This may have happened because an `Annotated` type alias using the `type` statement was used, or if the `Field()` function was attached to a single member of a union type.
  warnings.warn(
Intel MKL WARNING: Support of Intel(R) Streaming SIMD Extensions 4.2 (Intel(R) SSE4.2) enabled only processors has been deprecated. Intel oneAPI Math Kernel Library 2025.0 will require Intel(R) Advanced Vector Extensions (Intel(R) AVX) instructions.
Intel MKL WARNING: Support of Intel(R) Streaming SIMD Extensions 4.2 (Intel(R) SSE4.2) enabled only processors has been deprecated. Intel oneAPI Math Kernel Library 2025.0 will require Intel(R) Advanced Vector Extensions (Intel(R) AVX) instructions.
Intel MKL WARNING: Support of Intel(R) Streaming SIMD Extensions 4.2 (Intel(R) SSE4.2) enabled only processors has been deprecated. Intel oneAPI Math Kernel Library 2025.0 will require Intel(R) Advanced Vector Extensions (Intel(R) AVX) instructions.
Intel MKL WARNING: Support of Intel(R) Streaming SIMD Extensions 4.2 (Intel(R) SSE4.2) enabled only processors has been deprecated. Intel oneAPI Math Kernel Library 2025.0 will require Intel(R) Advanced Vector Extensions (Intel(R) AVX) instructions.
Intel MKL WARNING: Support of Intel(R) Streaming SIMD Extensions 4.2 (Intel(R) SSE4.2) enabled only processors has been deprecated. Intel oneAPI Math Kernel Library 2025.0 will require Intel(R) Advanced Vector Extensions (Intel(R) AVX) instructions.
Intel MKL WARNING: Support of Intel(R) Streaming SIMD Extensions 4.2 (Intel(R) SSE4.2) enabled only processors has been deprecated. Intel oneAPI Math Kernel Library 2025.0 will require Intel(R) Advanced Vector Extensions (Intel(R) AVX) instructions.
Intel MKL WARNING: Support of Intel(R) Streaming SIMD Extensions 4.2 (Intel(R) SSE4.2) enabled only processors has been deprecated. Intel oneAPI Math Kernel Library 2025.0 will require Intel(R) Advanced Vector Extensions (Intel(R) AVX) instructions.
Intel MKL WARNING: Support of Intel(R) Streaming SIMD Extensions 4.2 (Intel(R) SSE4.2) enabled only processors has been deprecated. Intel oneAPI Math Kernel Library 2025.0 will require Intel(R) Advanced Vector Extensions (Intel(R) AVX) instructions.
Intel MKL WARNING: Support of Intel(R) Streaming SIMD Extensions 4.2 (Intel(R) SSE4.2) enabled only processors has been deprecated. Intel oneAPI Math Kernel Library 2025.0 will require Intel(R) Advanced Vector Extensions (Intel(R) AVX) instructions.
Intel MKL WARNING: Support of Intel(R) Streaming SIMD Extensions 4.2 (Intel(R) SSE4.2) enabled only processors has been deprecated. Intel oneAPI Math Kernel Library 2025.0 will require Intel(R) Advanced Vector Extensions (Intel(R) AVX) instructions.
/Users/hugomacdermott/miniconda3/envs/openadmet-demos/lib/python3.12/site-packages/openadmet/models/comparison/posthoc.py:737: FutureWarning: Setting an item of incompatible dtype is deprecated and will raise an error in a future version of pandas. Value '***' has dtype incompatible with float64, please explicitly cast to a compatible dtype first.
  significance[(hsd.pvalue < self.sig_levels[2]) & (hsd.pvalue >= 0)] = "***"
Reading in model: lgbm (25, 6)
Reading in model: chemprop (25, 6)
Reading in model: multitask (25, 6)
Levene's test results
-------------------------
+--------------+-------------+-----------+-----------+-------------+
|          mse |         mae |        r2 |      ktau |   spearmanr |
|--------------+-------------+-----------+-----------+-------------|
| 15.3368      | 9.0868      | 2.52168   | 2.8462    |    1.8035   |
|  2.82785e-06 | 0.000302768 | 0.0873985 | 0.0646163 |    0.172083 |
+--------------+-------------+-----------+-----------+-------------+

Tukey's HSD results
-------------------------
+----------------------+-----------+------------+-------------+-------------+
| method               | metric    |      value |   errorbars |     p-value |
|----------------------+-----------+------------+-------------+-------------|
| lgbm - chemprop      | mse       | -0.0448613 |   0.0235377 | 6.0121e-05  |
| lgbm - multitask     | mse       |  0.0692462 |   0.0235377 | 2.78765e-09 |
| chemprop - multitask | mse       |  0.114107  |   0.0235377 | 0           |
| lgbm - chemprop      | mae       | -0.0285522 |   0.0098576 | 4.42271e-09 |
| lgbm - multitask     | mae       |  0.0554412 |   0.0098576 | 0           |
| chemprop - multitask | mae       |  0.0839934 |   0.0098576 | 0           |
| lgbm - chemprop      | r2        |  0.0568517 |   0.0268932 | 9.21074e-06 |
| lgbm - multitask     | r2        |  0.147037  |   0.0268932 | 0           |
| chemprop - multitask | r2        |  0.0901851 |   0.0268932 | 4.1225e-11  |
| lgbm - chemprop      | ktau      |  0.0184267 |   0.0106302 | 0.000264308 |
| lgbm - multitask     | ktau      |  0.0807836 |   0.0106302 | 0           |
| chemprop - multitask | ktau      |  0.0623569 |   0.0106302 | 0           |
| lgbm - chemprop      | spearmanr |  0.0213372 |   0.012386  | 0.000289132 |
| lgbm - multitask     | spearmanr |  0.0997481 |   0.012386  | 0           |
| chemprop - multitask | spearmanr |  0.0784109 |   0.012386  | 0           |
+----------------------+-----------+------------+-------------+-------------+
Now, in model comparisons, you should find these outputs:
Levene.json- file containing results of Levene test which assesses homogeneity of variances among groupsTukey_HSD.json- file containing confidence intervals for Tukey HSD (honestly significant difference) test for pairwise comparisons between modelsanova.pdf- ANOVA (analsyis of variance) plot showing whether each metric across all the compared models are statistically signficantly different; p-value ≤ 0.05mcs_plots.pdf- multiple comparisons similarity plot where the color denotes effect size and asterisk annotations denote statistical significancemean_diffs.pdf- plot of confidence intervals of the difference in mean performance between models; intervals that do not cross the zero line imply statistical significancenormality_plots.pdf- plots to show how normal the distribution of metrics are to check assumptions of parametric tests, e.g. ANOVA, etc.paired_plots.pdf- plots to check pairwise relationships between metrics across the comparing modelsposthoc.pdf- a file containing the tabulated Levene and Tukey HSD results
Interpreting the comparison plots
Let’s walkthrough how you might interpret some of these generated plots.
Levene Test
The Levene test assesses the homogeniety of variances among groups and checks the assummption of equal variances, which is required for the ANOVA test to be valid.
If the p-value for the Levene test is not significant (p > 0.05), then equal variances can be assumed and the ANOVA is valid.
If it is significant (p < 0.05), the variances are not equal and you should use the more robust Welch’s ANOVA instead.
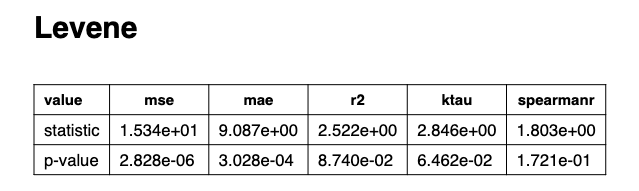 .
.
From this model comparison, we can see that the only significant p-values are MSE and MAE, so we know that any apparent significance in the following one-way ANOVA plots are invalid and a follow Welch’s ANOVA test should be performed.
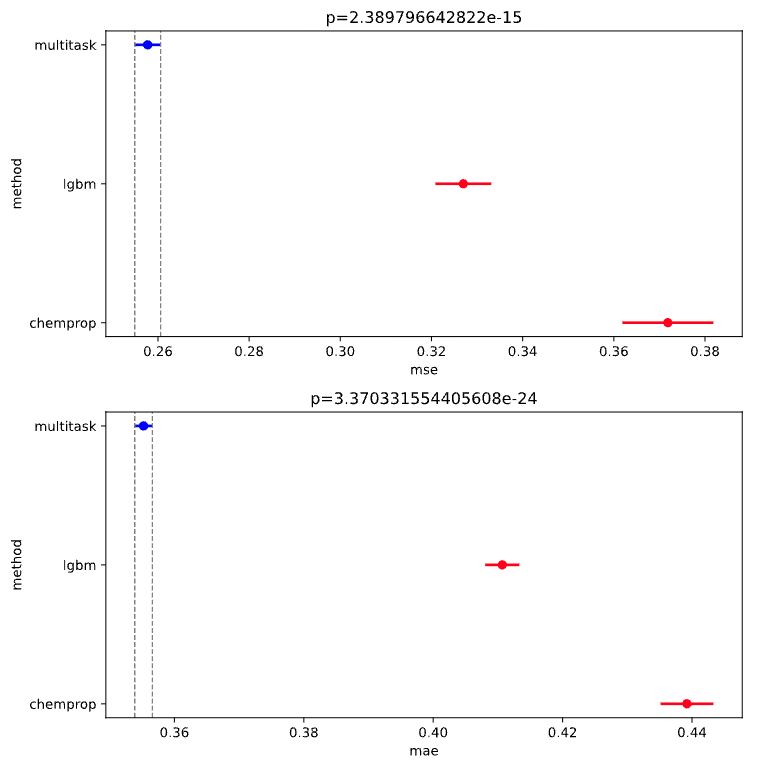
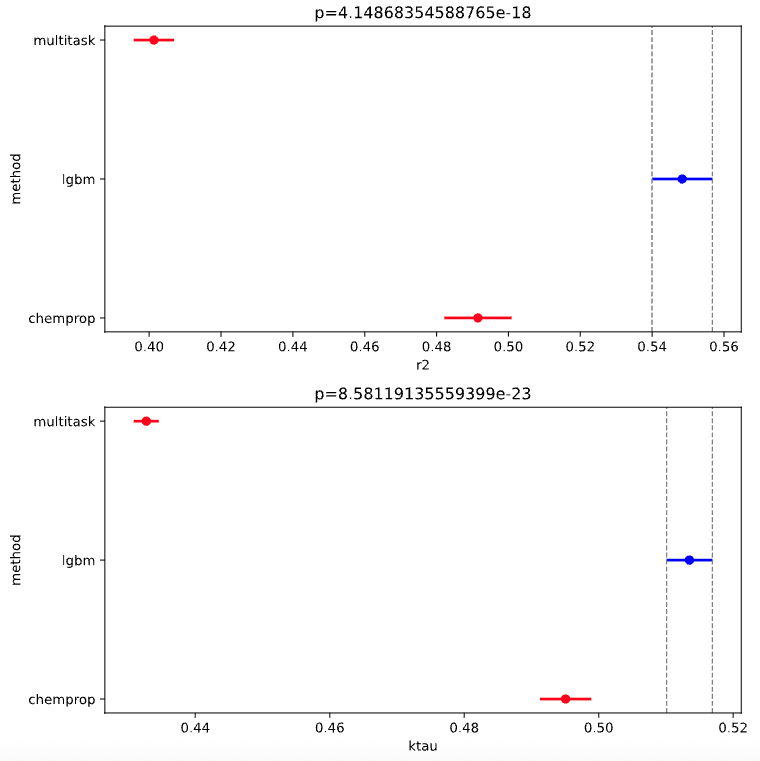
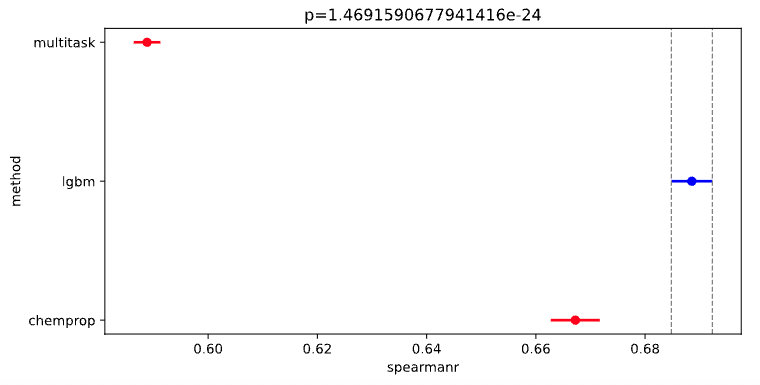
ANOVA
First, consider the anova.pdf. The analysis of variance (ANOVA) is a statistical test that determines whether there are significant (p-value ≤ 0.05) differences between the means of three or more groups. In this specific case, we are checking whether each model performance metric is meaningfully different from the others and that any differences are not just due to random noise.
NOTE: The models plotted in blue are the best for each metric.
 .
. .
. .
.
Although we know that the equal variance assumption for MSE and MAE ANOVA tests is invalid, for the sake of this demonstration, (if we assume valid ANOVA) you can interpret the plots as:
we can conclude from these plots that the multitask ChemProp model has the best mean squared error (MSE) and mean absolute error (MAE). In other words, the multitask model out performs the LGBM and single task ChemProp model in predicting values that are close to the target values in the test set (on average)
However, the LGBM model has the highest:
\(R^2\), which gives an idea of how well the variance in the actual values is explained by the model, aka goodness-of-fit.
Kendall’s \(\tau\), which measures how similar the rank order of predictions is to the rank order of true values.
Spearman’s \(\rho\), which also measures ranking, but more specifically, whether larger true values tend to correspend to larger predictions, even if not linearly.
Thus depending on your use-case, you may prefer a model with higher numerical accuracy (the multitask ChemProp model) for more accurate activity predictions OR you may prefer a model that is better at predicting ranking of activities (the LGBM model).
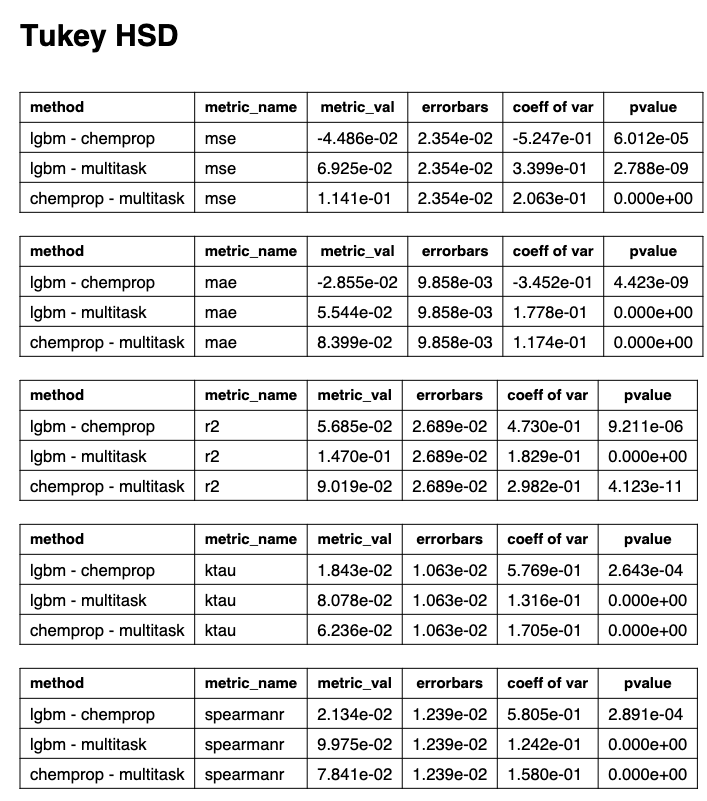
TukeyHSD
Having established that there are significant differences between model metrics with ANOVA, we can determine both the means of distributions under comparisons are the same and the magnitude of the differences in mean between the distributions with Tukey honestly significant differences (HSD).
 .
.
Pairs with a p-value < 0.05 are statistically different and the exact difference is shown under the metric_val column.
You’ll also notice that TukeyHSD also yields error bars, which can be used to construct confidence intervals.
These results are visualized in the following mean differences plots.
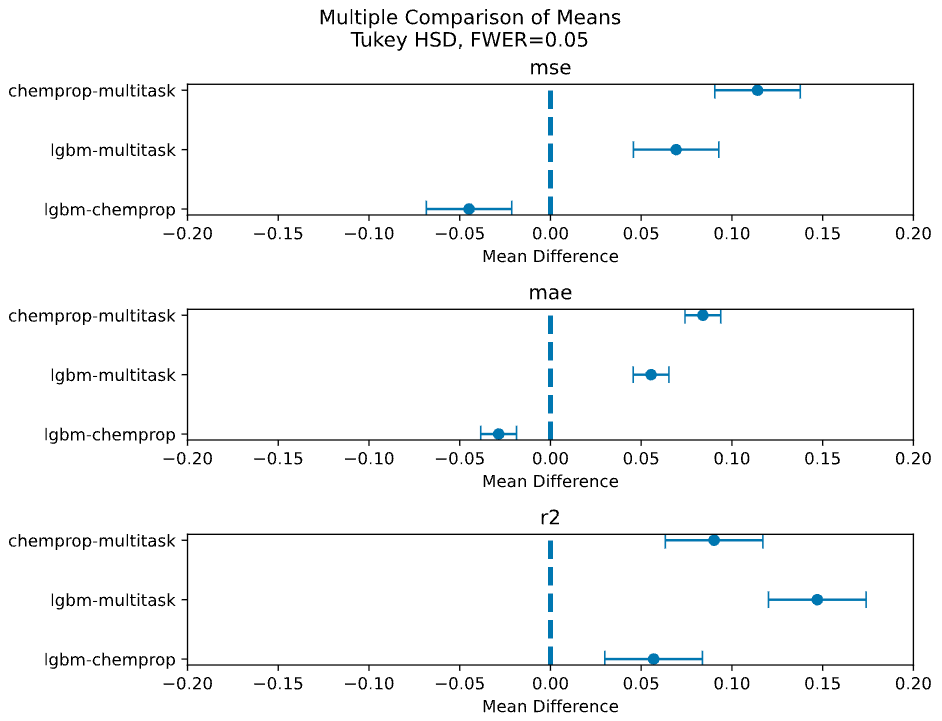
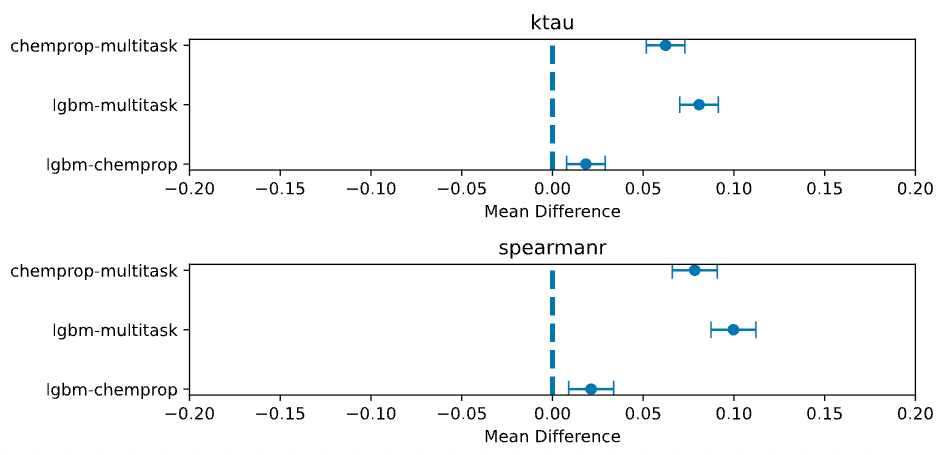
Mean Differences
These plots are another visualization of pairwise differences between model means that show the magnitude and direction in difference with 95% confidence intervals.
Each point is the difference in means between the two compared models, e.g. chemprop-multitask.
 .
.
 .
.
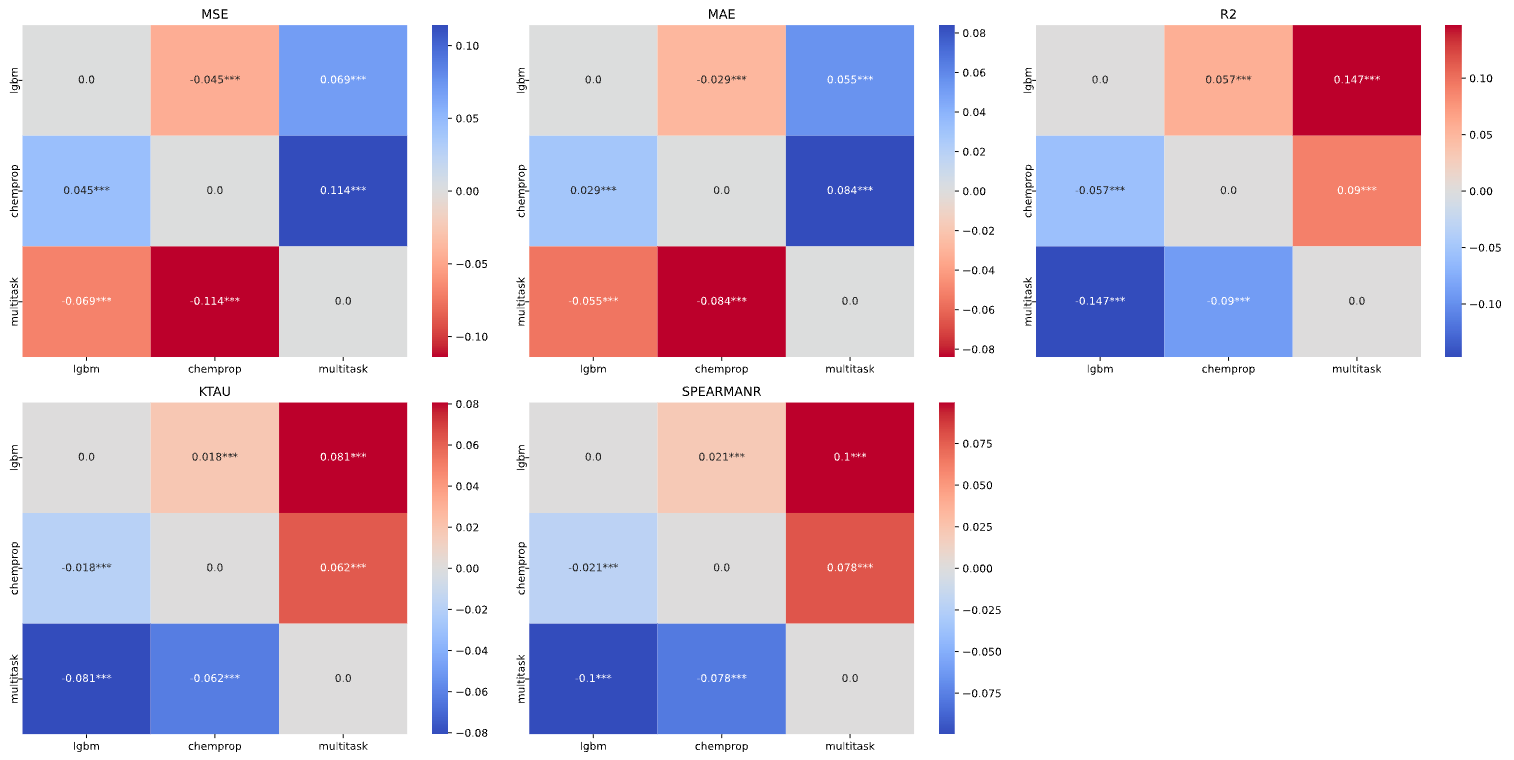
Multiple Comparison Similarity
These heatmaps visualize how similar or different the performance metrics (MSE, MAE, \(R^2\), Kendall’s \(\tau\), Spearman’s \(\rho\)) are from each other pairwise across different models.
Larger values are more similar and smaller/negative values mean are more different.
From these heatmaps, we can see that despite the LGBM model appearing to have better \(R^2\), Kendall’s \(\tau\), and Spearman’s \(\rho\) from the ANOVA plots, the multitask model actually performs very similarly to the LGBM model.
 .
.
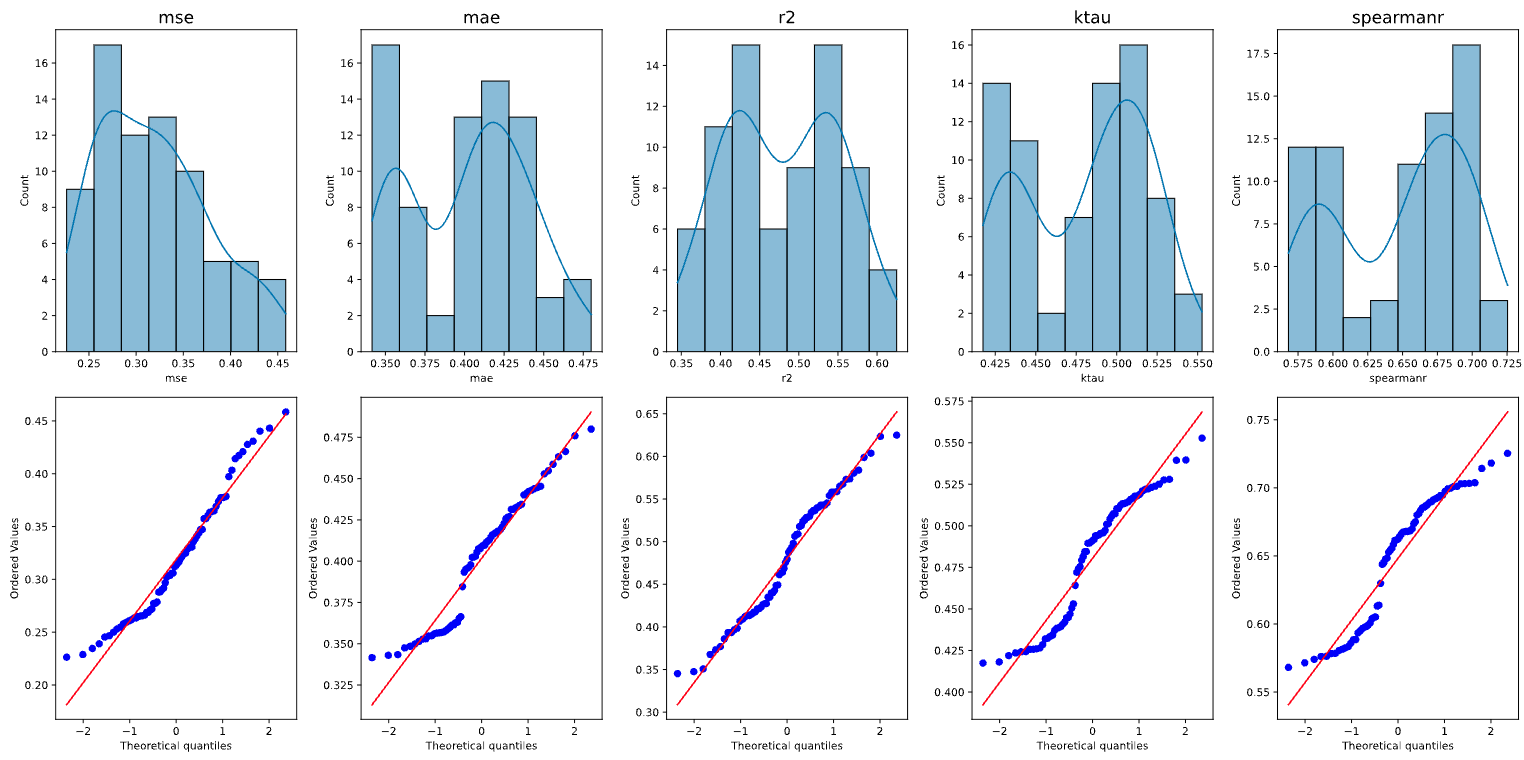
Normality Plots
These plots check the normality of the distribution of your metrics as sampled from cross validation. Most ANOVA and t-tests assume residuals are normally distributed.
With these plots, we are able to gauge the reliability of our parametric tests by checking the normality. Points that lie close the line are normally distributed, but in this case, we see some curving of the points from the line, implying that the residuals are skewed.
 .
.
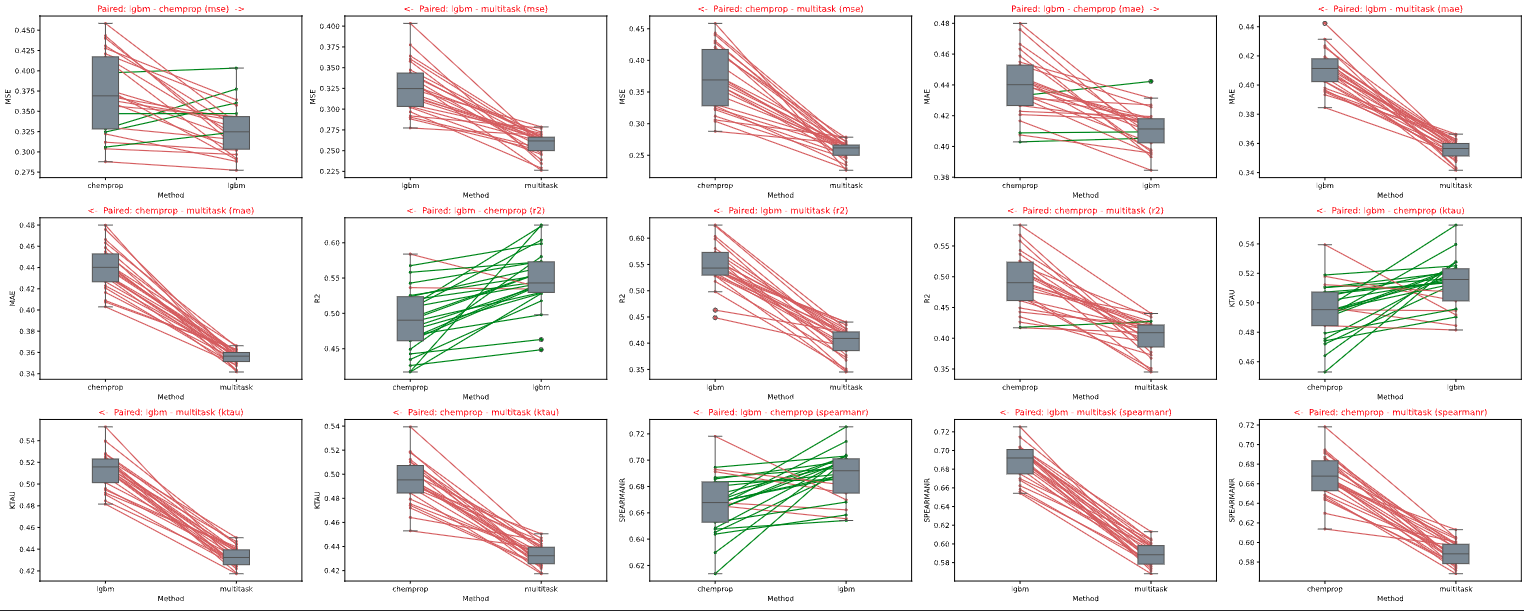
Paired plots
Paired plots also visualize pairwise comparisons of our metrics between models on each cross validation fold. This can be a useful view for seeing how each fold performed between models.
Moving forward, we will use our LGBM model due to its superior ranking abilities and for ease of inference on a CPU.
- Now lets take it up a notch by training a model ensemble!
End of
03_Comparing_Models~